
Hunger Gap Map: Hunger in the Tampa Bay Area
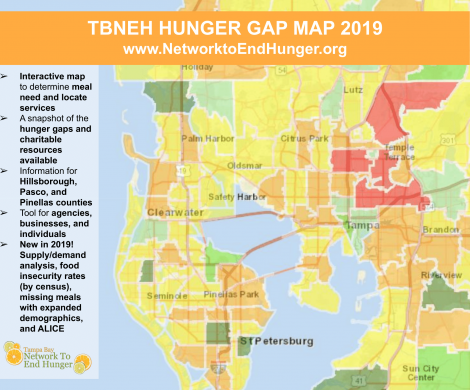
NEW in 2019… The latest map update includes new supply and demand analysis, as well as new layers like food insecurity rates (by census tract), missing meals with expanded demographic population information, and ALICE (Asset Limited, Income Constrained, Employed).
GIS (Geographic Information System) HUNGER GAP MAP Information
This map allows individuals and organizations to see meal and hunger gaps in our local community so they can better plan resource distribution and food access programs.
TBNEH’s Hunger Gap Map is unique because it uses an ArcGIS mapping program to show the number of missing meals more specifically, by zip code, rather than by county. Users can customize the map’s data to obtain individualized information they can use in their work, research, or grant applications.
The Hunger Gap Map provides:
- Color coded meal gap (ie. green areas have a good balance of supply and demand; red areas do not)
- Colorful visual, along with the statistics, suggest opportunities for further program development
- Layers showing food insecurity rates, SNAP Retail locations, meal provider locations, demographic information, and more.
- A layer showing bus routes and stops.
Users may request a detailed summary report of a specific zip code(s) or layer(s) by submitting a request through our contact form.
Getting Started:
Click HERE for detailed instructions on how to navigate the Hunger Gap Map.
or
Click the VIEW HUNGER GAP MAP button to go directly to the map. You may be asked to download the Silverlight plug-in, if so, click “run”. This will allow you to view the map on www.arcgis.com.
Viewing the Hunger Gap Map:
– Once you have opened the map, click the arrow in the bar on the far left top corner of the map to expand the layers menu. This will allow you to access the different layers of the map.
– The compass on the bottom far left of the map will allow you to move around the map.
Please feel free to CONTACT US with any questions regarding the Hunger Gap Map.
“The Hunger Gap Map is an important tool and we see it as a major part of the programmatic solution to hunger,” said Caitlyn Peacock, Executive Director, TBNEH. “The purpose of this unique map is to translate food insecurity and direct service provider services into a single map that can be used for decision making and program development.”
The map was originally developed seven years ago by a TBNEH work team, in response to an agency and community need of wanting to know the supply and demand of hunger. To complete the analysis, multiple reports were used, including Feeding America’s Missing Meal Analysis, which analyzes several variables including the number of food-insecure persons and the cost of food and meals; and Neilsen Companies’ In-store scanning and Homescan data, which includes the cost of food index. The supply and demand was determined by investigating charitable response, or the total number of meals distributed from the emergency food system (including mobile pantries, senior meals, weekend bags for children, food pantries, and hot meal providers), and by tracking the raw number of meals needed.
Agencies, academia, businesses, and individuals can access the user-friendly TBNEH Hunger Gap Map below and use the information to help identify what specific programs would be needed to help close the hunger gap in specific areas. This map is an educational tool that can help providers gather the information needed to help expand and/or develop new programs to address need. Organizations, like Meals On Wheels and St. Petersburg Free Clinic, have used the map to expand their services, while increasing the amount of food distributed in high-need areas. Community members looking for food or community resources are encouraged to use the Hunger Gap Map to locate services.
Meals On Wheels of Tampa uses the Hunger Map as a vital strategic tool in determining expansion plans and community needs assessments. In addition to a planning guide, the Hunger Map serves as an important resource to help tell the story to our funders of the depth and width of food needs in our community,”
Cindy Vann, Director of Major Gifts at Meals On Wheels of Tampa.
“The Hunger Map has been a valuable tool for our Food Bank. It has helped us better understand the populations we serve and where the need is located. We have been able to refine our distribution through a combination of adding new partners, creating new pantries, and increasing the amount of food we distribute in high-need areas.”
– Shaina Bent, Director of Food Programs at St. Petersburg Free Clinic.